
Creating a scalable data table component in Figma
Campfire 32: Data is meaningless unless it can be visualized and acted upon. The success of future industries will be a combination of advanced data collection and improved user experience, and the data table will represent a large portion of this user e

Users can derive insights and commit actions by scanning, analyzing, comparing, filtering, sorting, and manipulating information in good data tables.
I'm gonna write a full article on how to design better data tables, but today we'll take a look at the practical side of things and build a scalable component for a data table.
I used this structure to build a data table component for a design system of a $2B company.
Let's get into it.
Design a column header
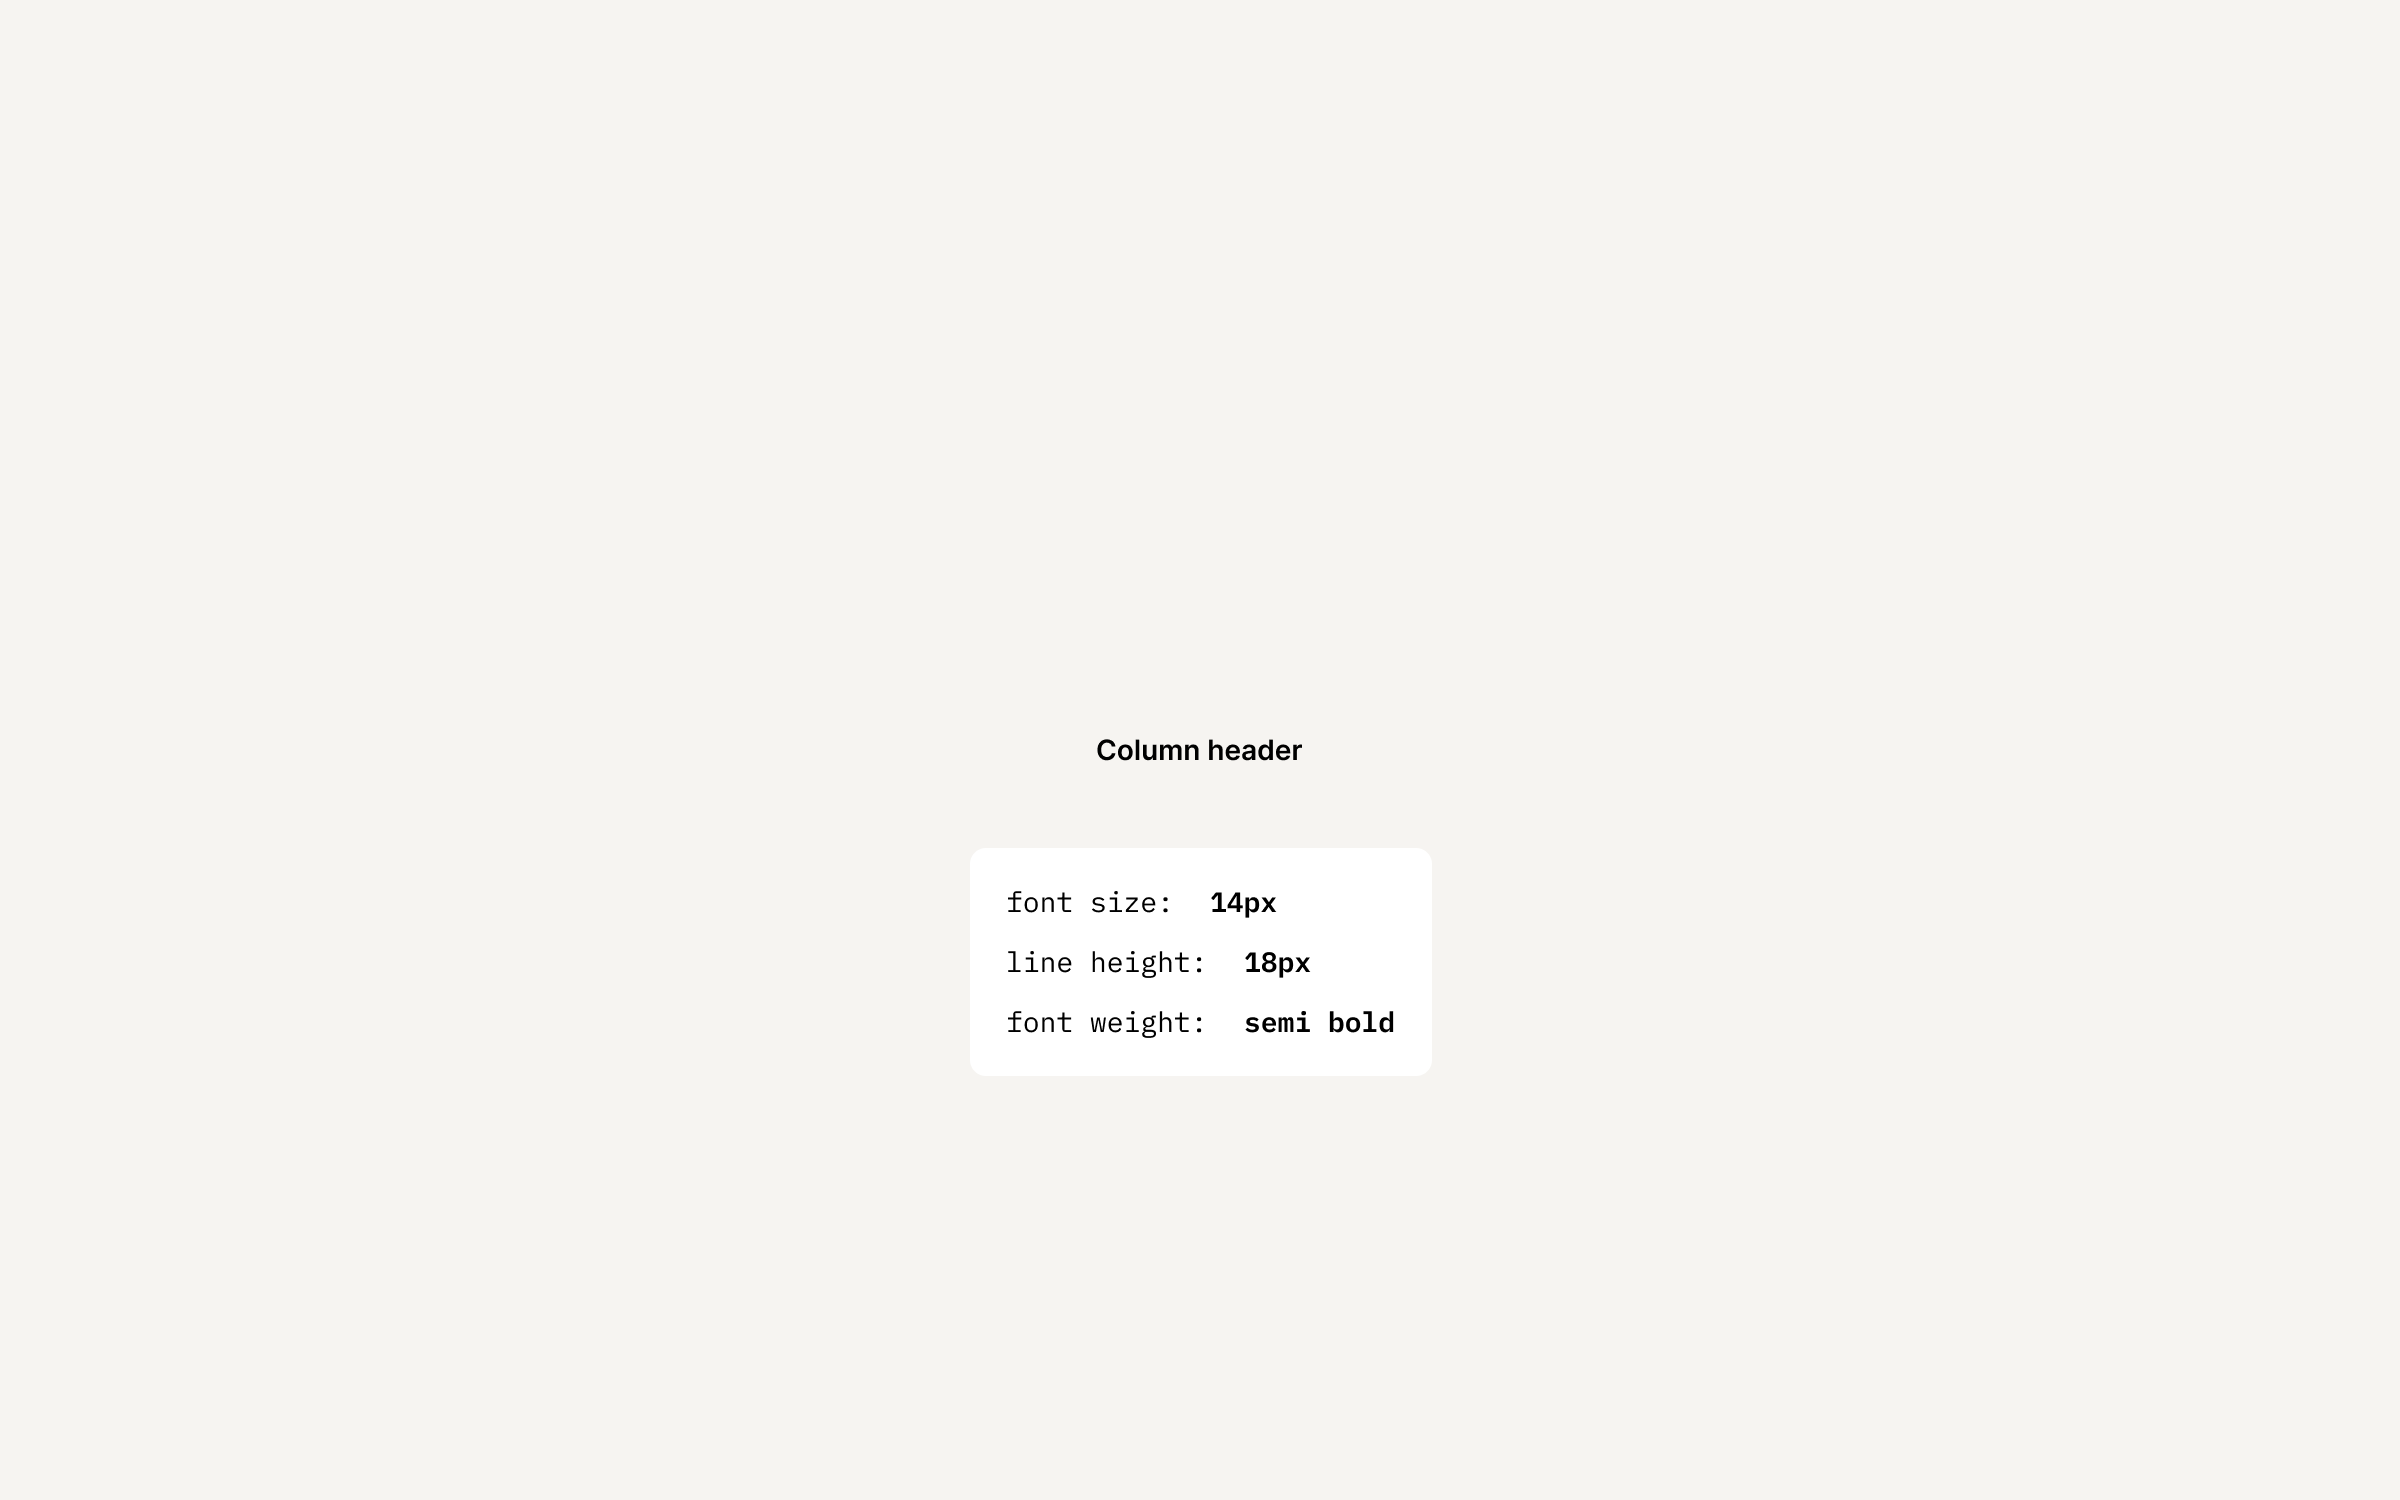
Column headers represent the label used for each column. They are essential parts of the table and give the user understanding of what type of data they're looking at.
To create a column header, let's start with a text label.
Now, wrap it up with an auto-layout frame and set spacings.

Rename it and duplicate a frame. Let's add a sorting icon to the new frame we created. And let's add a bottom border to both of the frames. Make both a component set.

This structure of the column header component allows us to add more variants for states, additional elements (such as icons), etc. Let's add a few here.
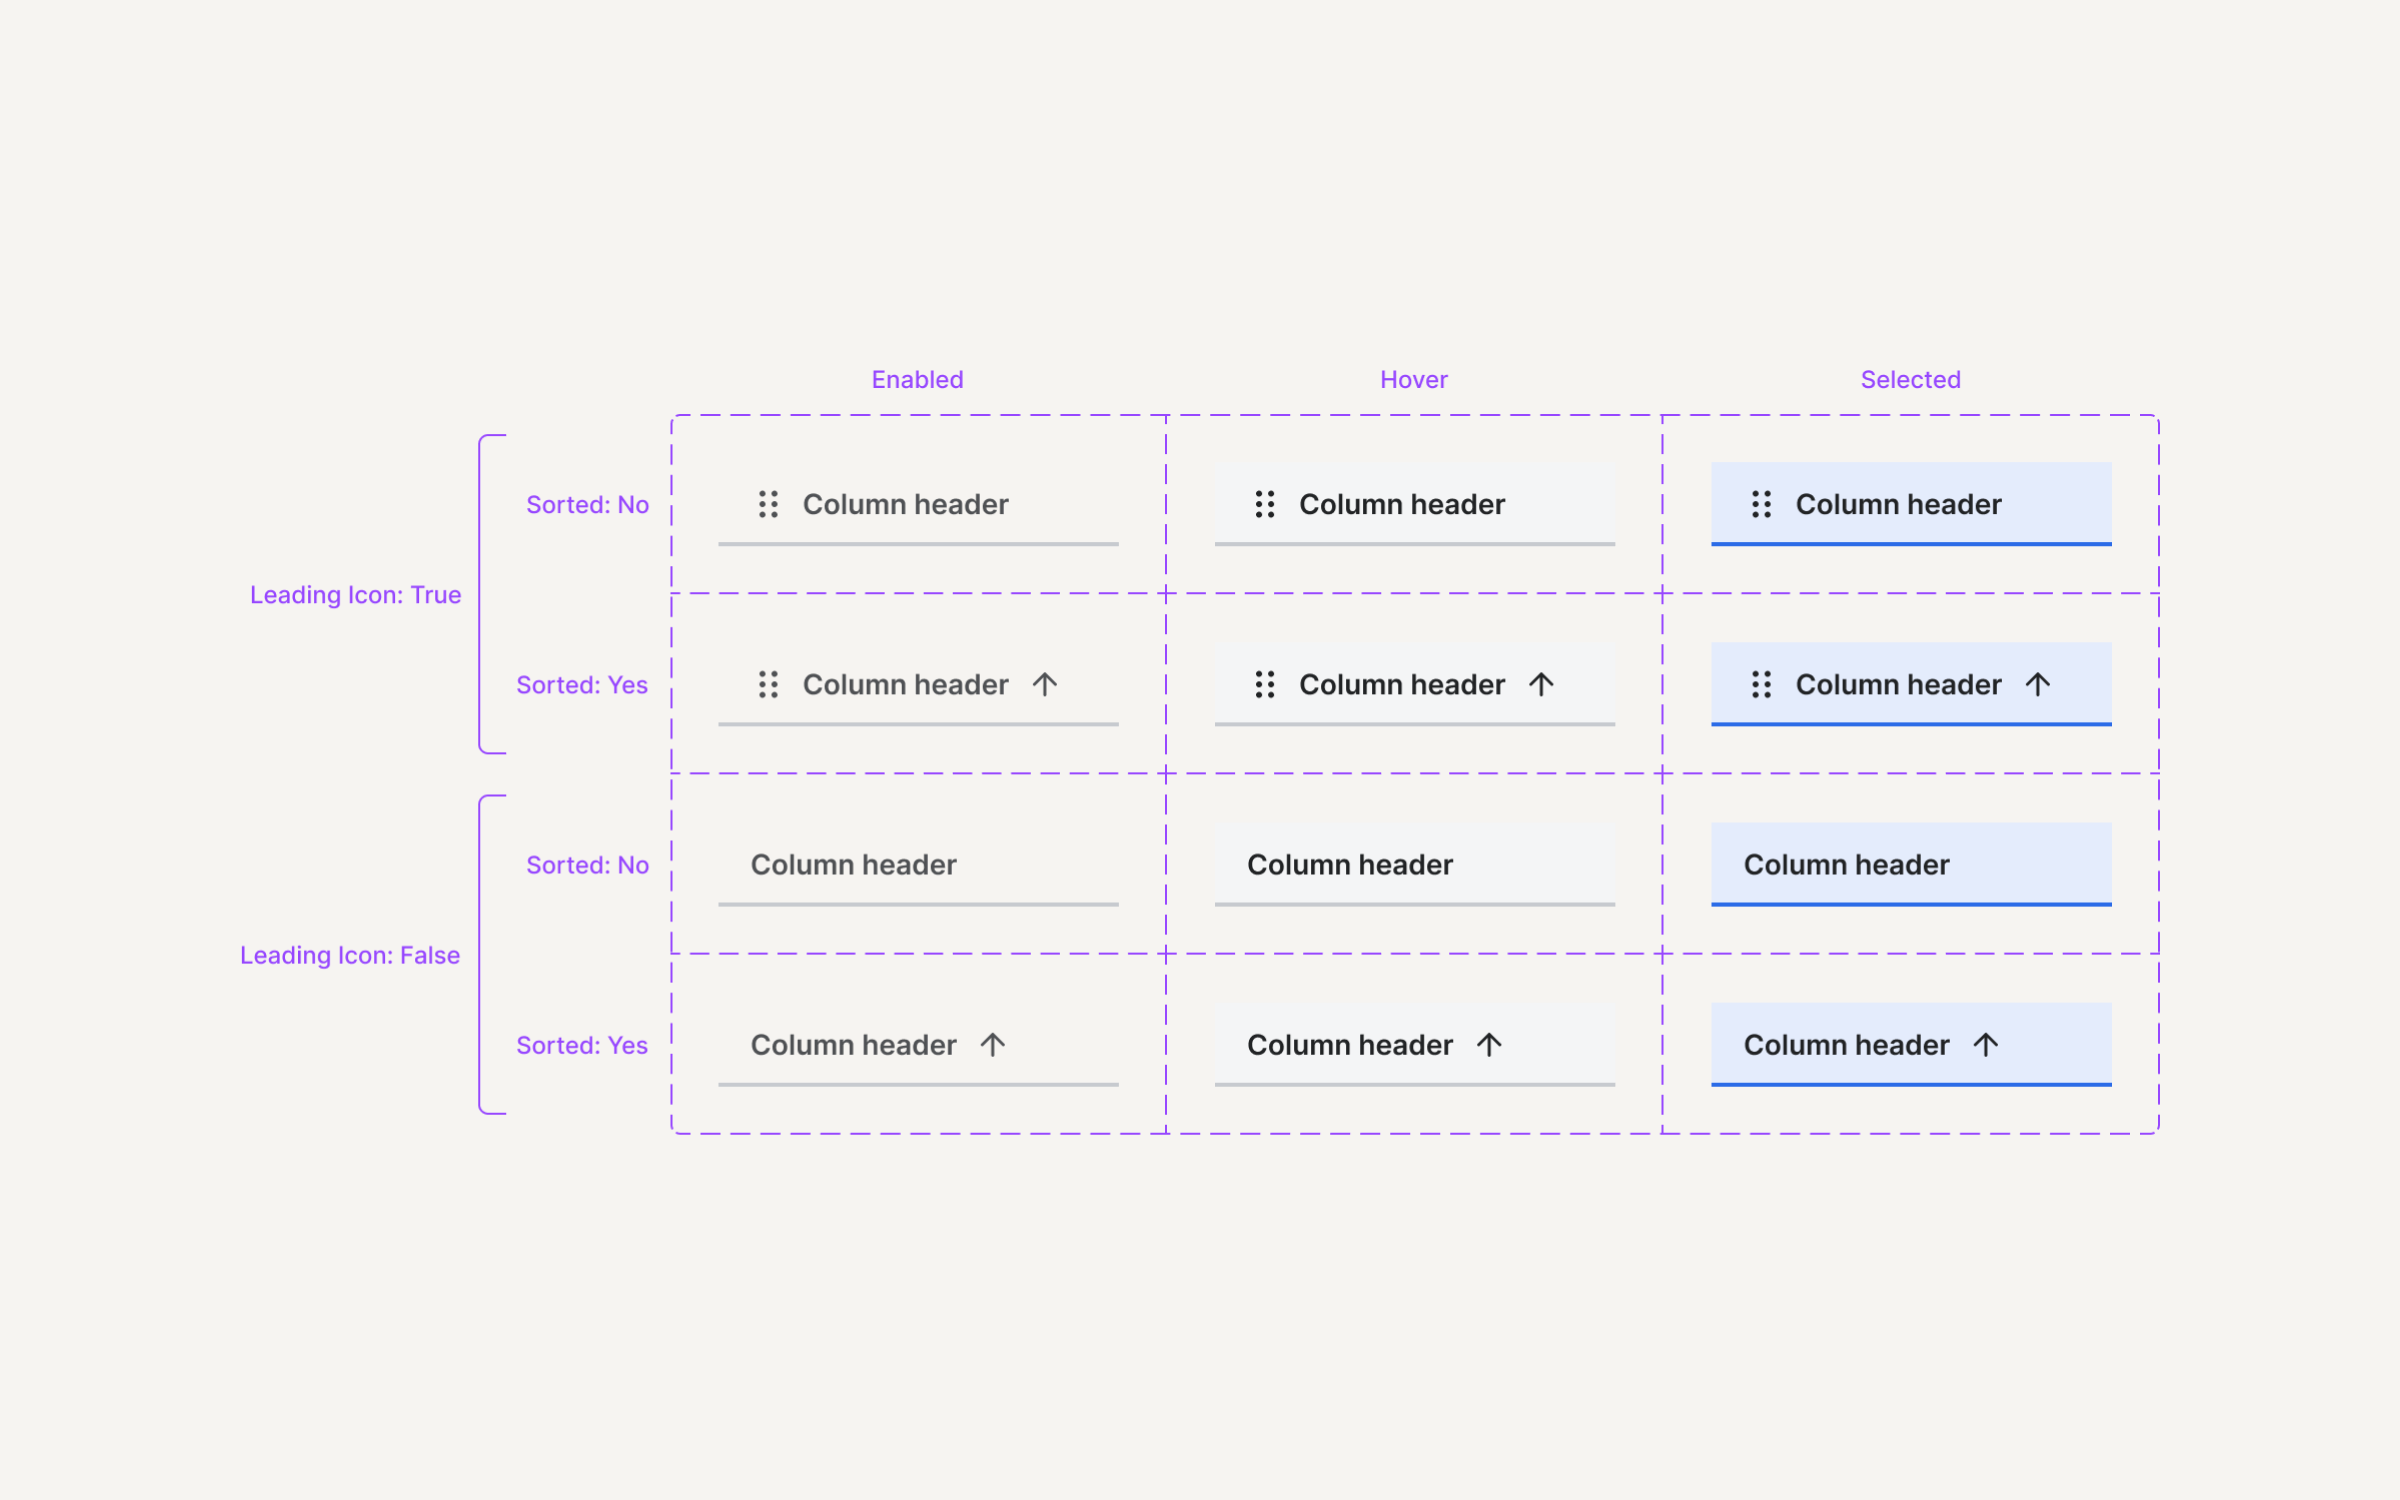
Our column header is ready to use!
Design a cell
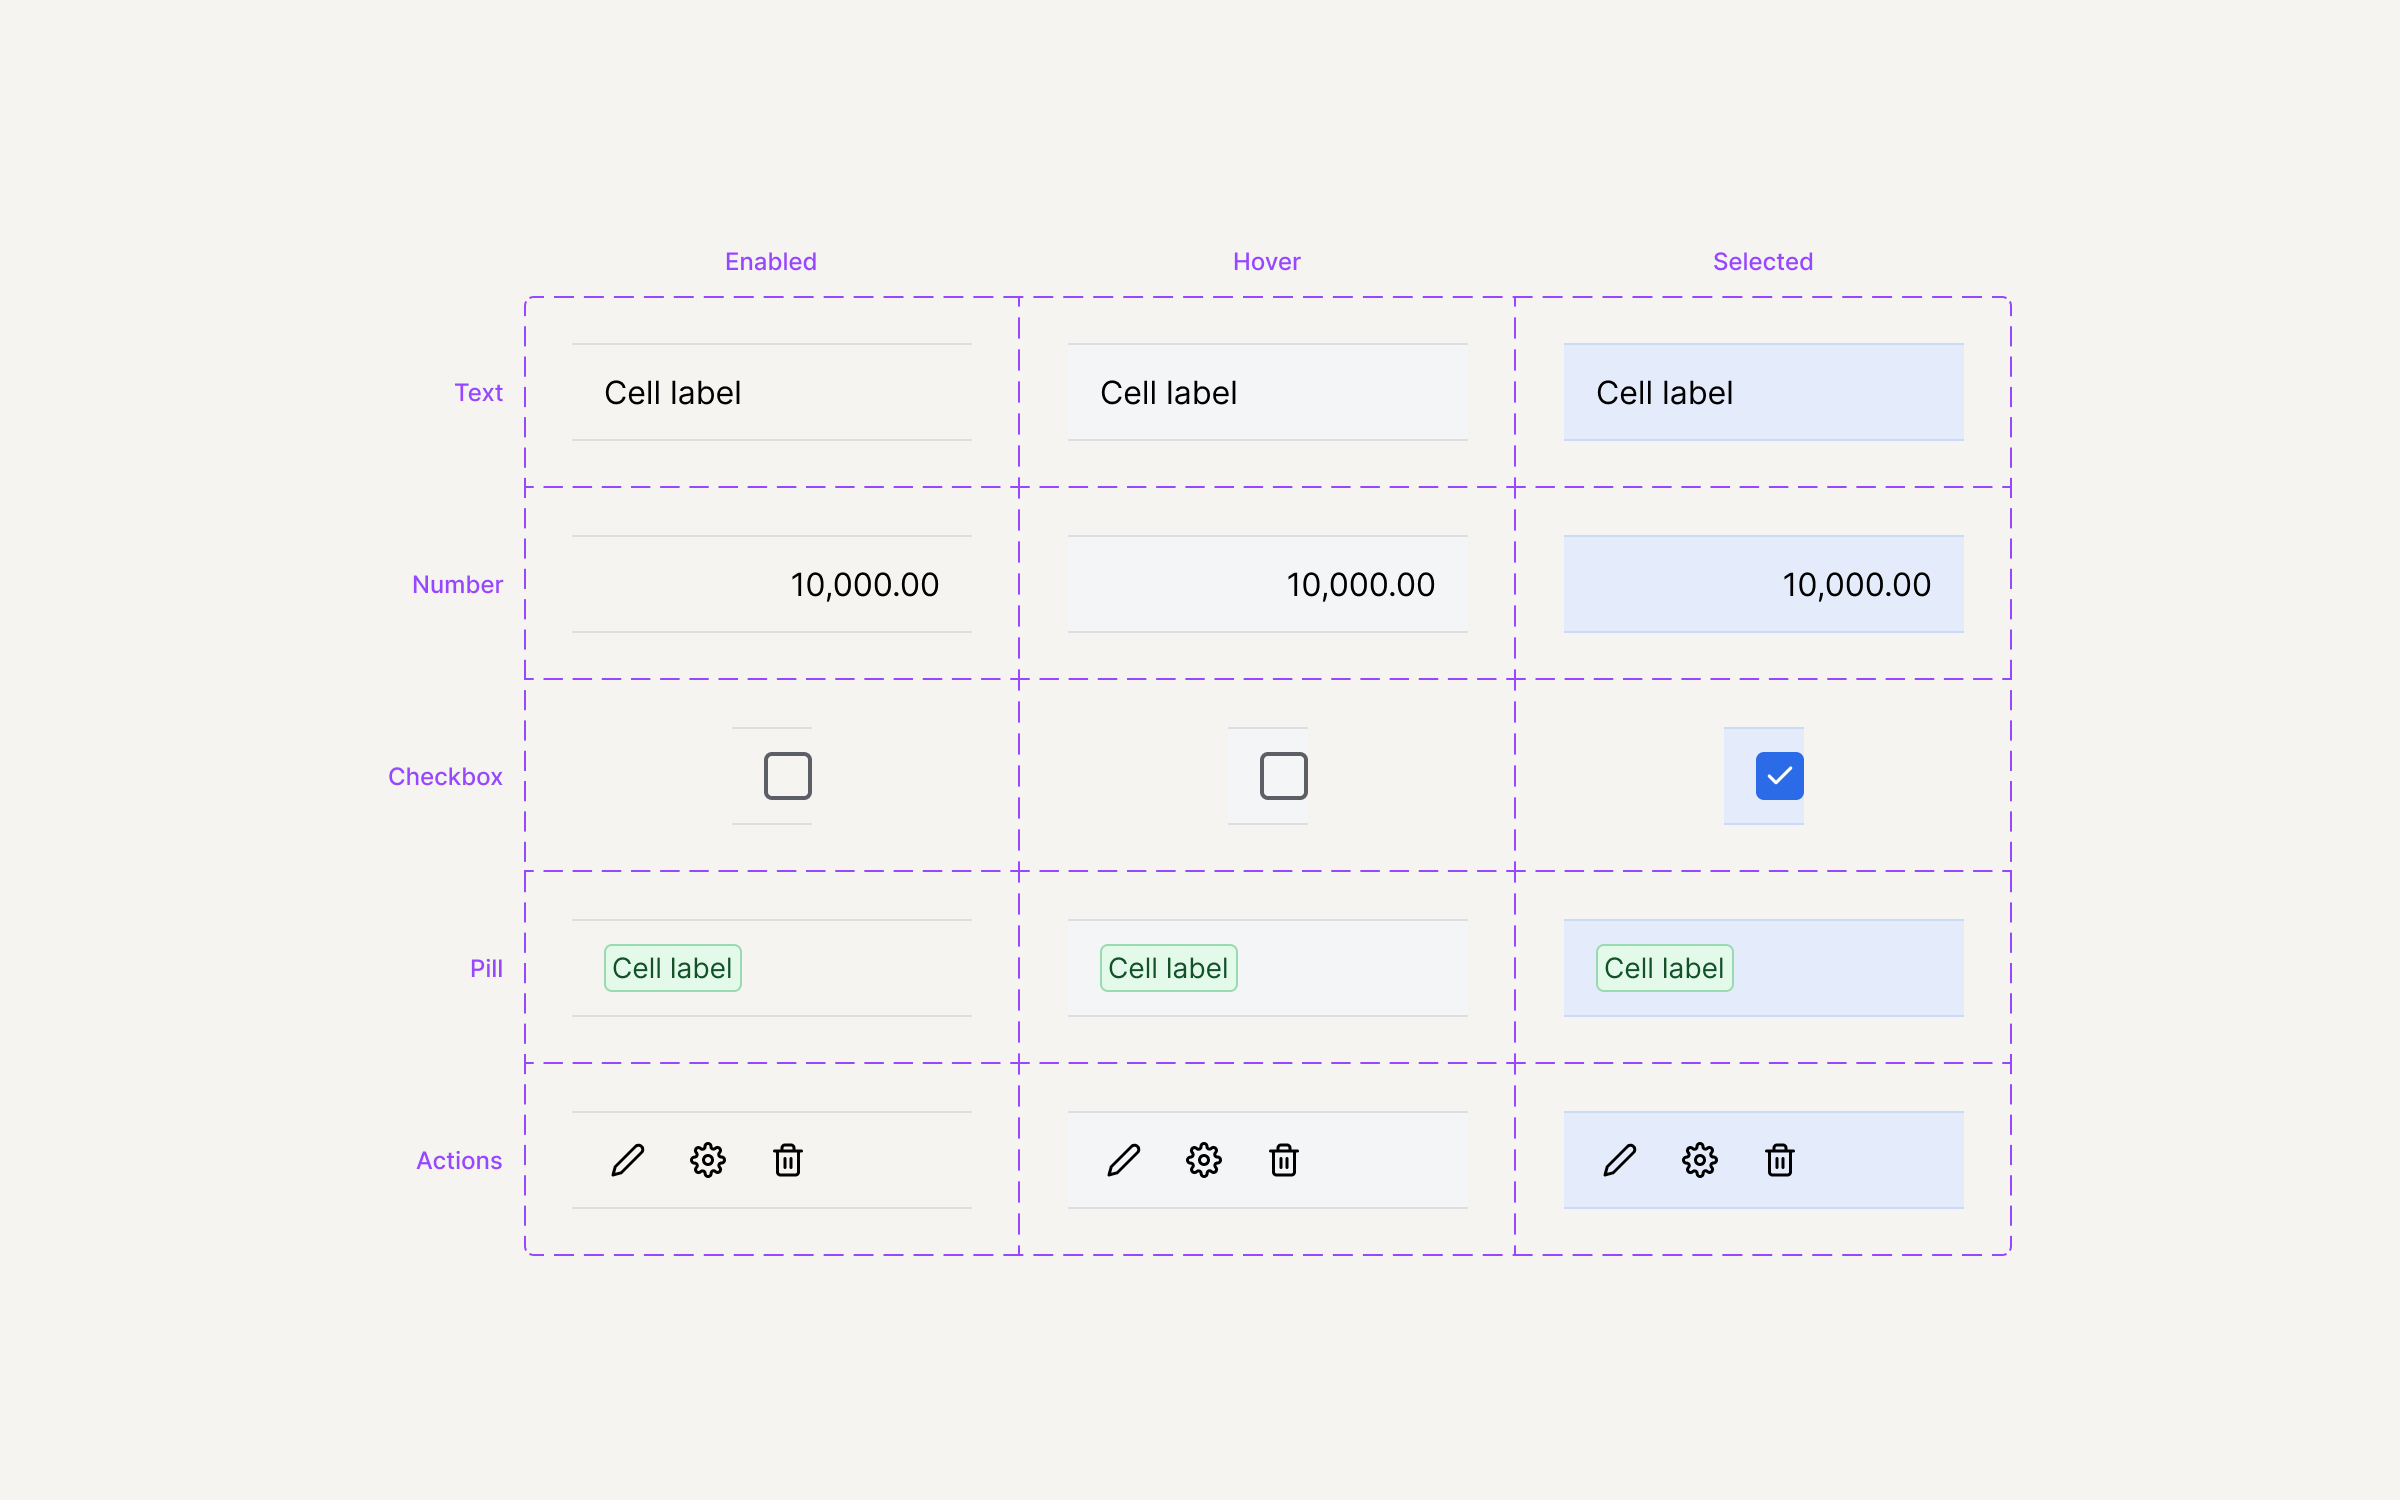
Cells are at the core of each table. They create a view of the data and can vary in type. The most basic one is a text cell. Let's create one first.
Starting with a label and adding an auto-layout frame around it. Setting the same horizontal spacings used for the column header in the first step.

We can use a different vertical spacing to make the cell a bit larger in height than the column header.
Now, duplicating, adding a few variants, and creating components set.
Put it all together
When we have component sets for both column header and cell, we can start designing our data table.
Let's make a new clean canvas and start adding our components to it.
Use the components we just created to create a row of column headers. Then do the same with the cells.

Let's add some data to our table to make it more real. I'm using a few types of cells here to indicate different data points.
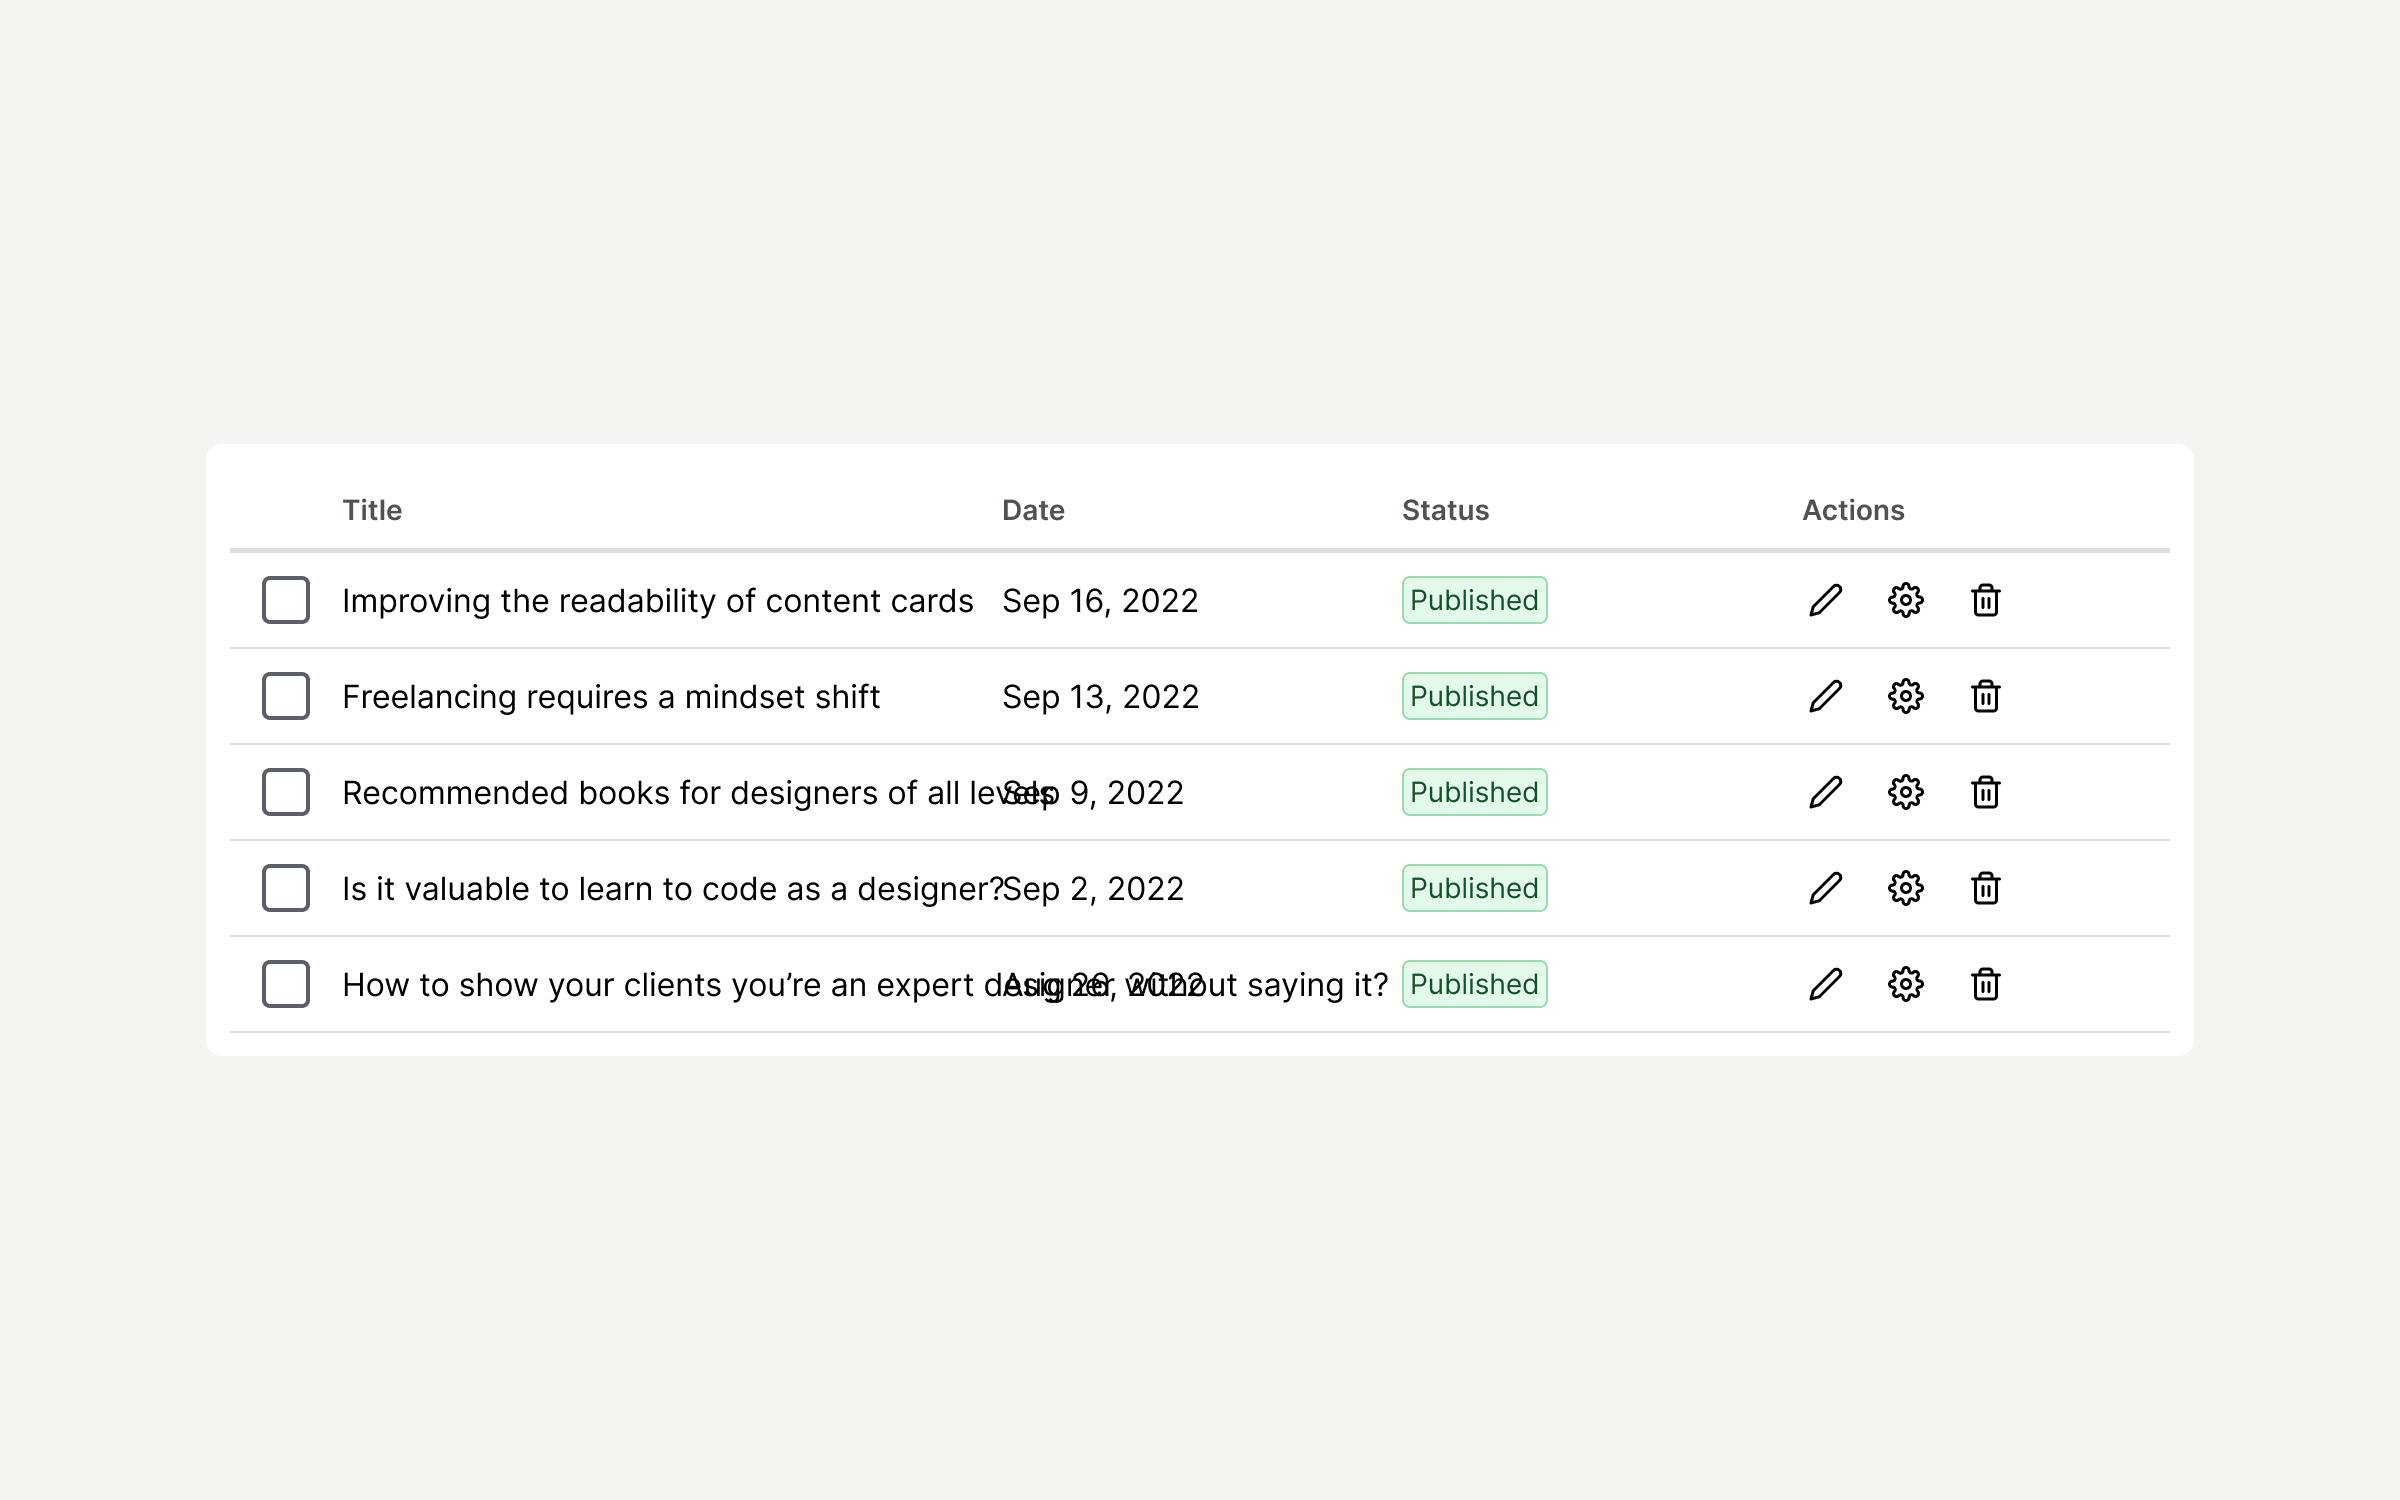
Tip: if you want your text to wrap and use "..." at the end — set the resizing parameter of the text layer to "truncate text".

That's it! This is a simple way to create a data table in Figma.
The component we have created is scalable, so if you want to add more cell types, states, or other variables — you can build a very advanced table with it.