The most important metrics designers must track
Because user experience is subjective, it's difficult for designers and product managers to create a clear and measurable goal.
A great designer establishes a standard for product UX and measures it regularly. Here are the top three metrics that designers should monitor.
System usability scale (SUS)
SUS offers a "quick and dirty" but credible tool for assessing usability. It consists of a ten-item survey with five answer options ranging from "Strongly agree" to "Strongly disagree."
How to measure
Get a template with ten questions or create a form on Typeform.
Give a survey to people familiar with your product (at least ten users outside your team). Remember, you need honest responses.
Calculate results and find a common value
(Result 1 + Result 2 + …+Result 10)/10
As a result, you will be given a single number, such as 65. Find your answer on this scale.
If your SUS is below 68, it is below average (https://measuringu.com/sus/).
Completion rates
Completion rate is the most basic usability metric. It's a binary measure of success or failure that gives a simple metric of progress. This metric is excellent for user flows with multiple actions or steps, such as registration, checkout, connecting to an API, etc.
How to measure
In general, you can use any analytics tool that supports funnels. Even though many designers might argue that funnels were created for marketers, funnels are great tools for finding the bottleneck in the system or figuring out why customers leave at a certain point.
Talk to your customers about those points and simplify the workflow for a more optimized experience when you have those identified.
Net promoter score (NPS)
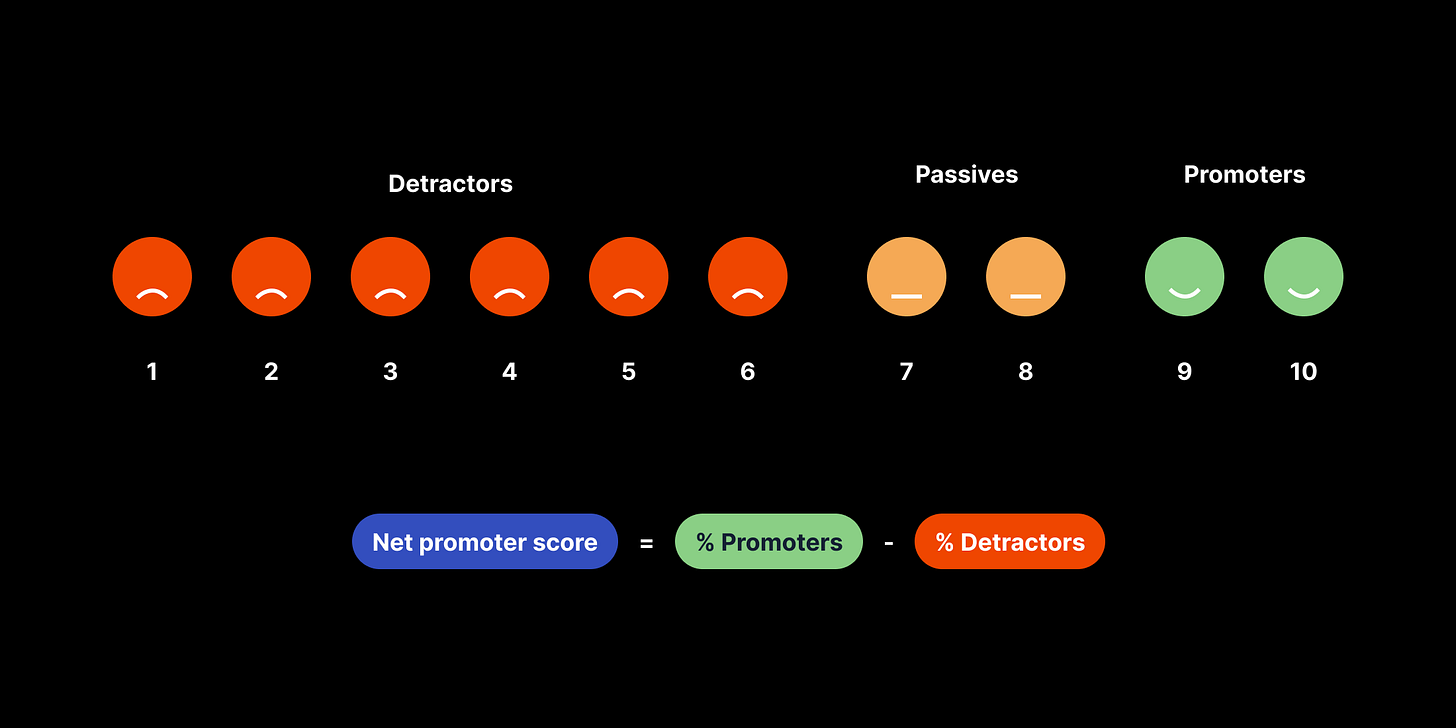
Net Promoter Score (NPS) is a metric for assessing customer loyalty to a company's brand, products, or services.
How to measure
The company has to ask its customers a straightforward question:
How likely would you recommend us to a friend or colleague?
Responses are given a score of zero to ten, with ten being the most positive. After this, customers are classified into three groups: Promoters, Passives, and Detractors.
There are many tools to calculate this metric, but I recommend using Delighted or Promoter.
And again, many folks might tell that NPS is not a design metric, and it was created to measure team success. But what I figured out was that bad NPS is related to bad UX and bugs in most cases.
Conclusion
As mentioned initially, UX is very subjective, but using at least the basic KPI to track UX is important. It helps you focus on the most critical tasks, set clear goals, and keep your minds open.


